Trend-Following Indicators on MT5: Prop Trading Applications
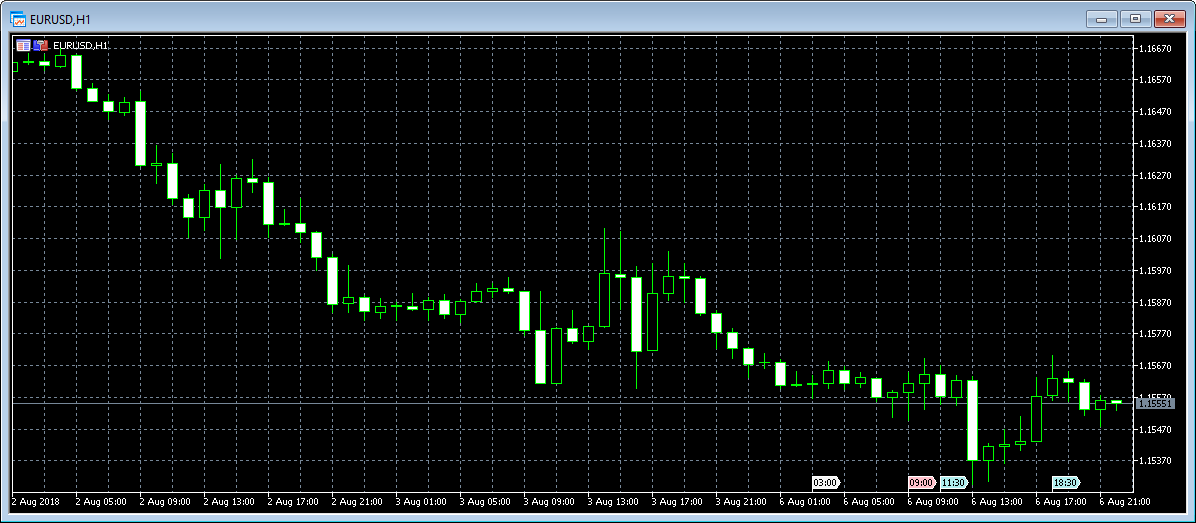
There is no space for guesswork when trading for a prop firm. They’re watching every trade you make. Your choices must be well-reasoned, rational, and ideally supported by facts. This is the point at which trend-following indicators are useful, particularly when utilizing MT5. It is important to learn trend-following indicators whether you’re a funded trader attempting to protect your capital or someone going through a difficult time. Let’s discuss everything about MT5 trend-following indicators in detail.
What’s a Trend-Following Indicator?
A trend-following indicator is a tool that traders use to determine whether the market is moving sideways, upward, or downward.
The concept is straightforward: don’t fight the trend, follow it. Surfing is like this. You ride the wave instead of paddling against it.
Trend-following indicators help you in identifying the start of a trend, verifying its strength, and, in certain situations, indicating when it may be ending. Prop traders will find this information invaluable. Why? Because in this game, risk management and consistency are crucial.
Why Trend-Following Matters in Prop Firm Trading
Prop firms don’t care about your one-hit wonder deals. They want to see that you can control risk, stick to a plan, and maintain a steadily rising equity curve. Unruly and choppy trades? You’ll be dismissed from the team before you can say margin call for it.
When applied correctly, trend-following techniques assist you in following high-probability configurations. Your goal is to catch the meat of the move, not to pick tops and bottoms.
Most prop firm accounts have drawdown limits as well. So, spending too much time on the wrong side of a trend? That is not acceptable. By using trend-following tools, you can minimize bad entries and continue trading in positions that are gaining momentum.
The Best Trend-Following Indicators on MT5 and How to Actually Use Them
MetaTrader 5 comes loaded with built-in indicators, and you can always install custom ones too. But you don’t need a hundred indicators. You just need to know how to use a few of them well.
Here are some top trend-following indicators on MT5 and how they can fit into your prop trading playbook.
Moving Averages
Moving averages are like the bread and butter of trend-following. Whether it’s the Simple Moving Average or the Exponential Moving Average, these indicators smooth out price action to help you spot the overall direction.
How prop traders use it:
- The 50 EMA and 200 EMA crossover is a classic strategy. When the 50 crosses above the 200, you’ve got a potential bullish trend. The reverse? Possible bearish move.
- Dynamic support/resistance: A rising EMA often acts as support in uptrends. In a downtrend, it can become resistance.
Use them to filter trades. For example, only take long trades when price is above the 200 EMA.
Quick Tip: The EMA reacts faster to price changes than the SMA, which is why many instant funding prop firm traders prefer it for short-term setups.
MACD (Moving Average Convergence Divergence)
Despite the intimidating name, MACD is straightforward. It’s basically a combo of moving averages that tells you whether a trend is gaining or losing strength.
What to watch:
- MACD line crossing above the signal line? Potential buy signal.
- MACD histogram flipping from negative to positive? Momentum might be shifting bullish.
How to use it in a prop trading setup:
Let’s say you’re already long based on a price action breakout. The MACD can help confirm the momentum behind your trade. If the histogram’s growing and the MACD line is diverging from the signal line, you’ve probably got some gas left in the tank.
But don’t rely on MACD alone. It’s a lagging indicator, so it works best as a confirmation tool, not an entry trigger.
ADX (Average Directional Index)
This one doesn’t receive nearly as much attention as it deserves. The ADX indicates the strength of the trend rather than its direction.
What the numbers mean:
- Below 20? Weak trend or consolidation.
- 20–40? Moderate trend.
- Above 40? Strong trend, time to ride it!
Prop trading tip:
Let’s say you’re eyeballing a breakout on the 15-minute chart. The price looks good, the volume’s picking up but you’re not sure if it’s a real move or a head fake. Flip on the ADX. If it’s below 20, be cautious. But if it’s ramping up past 25 or 30, that breakout might have some muscle behind it.
Parabolic SAR (Stop and Reverse)
This one literally puts dots on the chart to show you the current direction. Dots below the price = uptrend. Dots above = downtrend. Simple.
Why prop traders like it:
- It’s a quick visual reference to see if a trend is still valid.
- It can help you trail your stop-losses as the trade progresses.
- It performs better in markets that are trending than in chop.
Pair it with moving averages for better context. For example, only follow Parabolic SAR signals in the direction of the 50 EMA trend. That way, you’re not getting whipsawed in sideways price action.